Next: Real data
Up: Line Detection
Previous: Line Detection
Synthetic data
Due to the high number of lines (
![]()
![]() ) in Figure 4.6, only the vertical lines on the left side of the rectangles inside the image are investigated and shown in Table 4.2. As one can see in Figure 4.6, all lines have been found. The two horizontal lines at the bottom of object
) in Figure 4.6, only the vertical lines on the left side of the rectangles inside the image are investigated and shown in Table 4.2. As one can see in Figure 4.6, all lines have been found. The two horizontal lines at the bottom of object ![]()
![]() and
and ![]() have been rejected because they are perfectly horizontal and thus cannot be used for correspondence analysis. Normally the value, which classifies the lines into two groups to decide whether correspondence analysis make sense or not, is increased in order to get less outliers, as it is often with horizontal lines.
have been rejected because they are perfectly horizontal and thus cannot be used for correspondence analysis. Normally the value, which classifies the lines into two groups to decide whether correspondence analysis make sense or not, is increased in order to get less outliers, as it is often with horizontal lines.
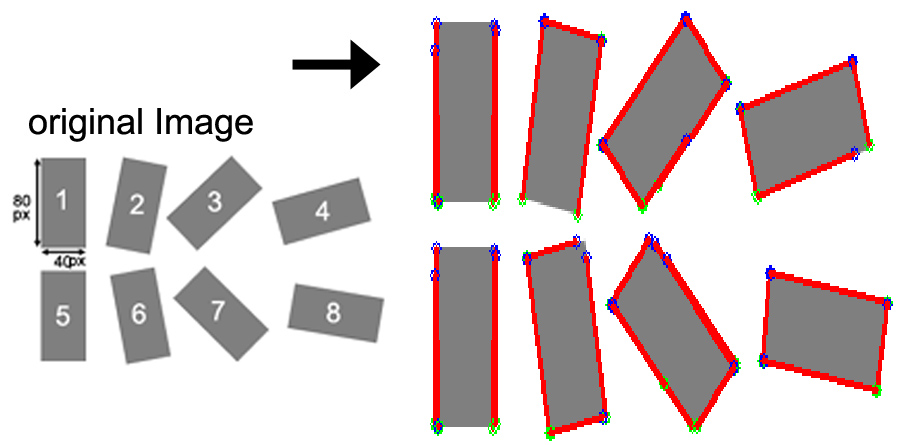 |
In Table 4.2 you can see the properties (2D image coordinates of the start and end point, attitude) of the lines shown in Figure 4.6. The result, especially of the start and end points is very accurate. The maximum deviation is +/- 1px, but for example the line at the bottom of object 4 only covers about 85 % of the line. The error in the attitude increases if the contingent of the counter in x direction decreases. Although one has to keep in mind that it is an ideal situation.
In real world the contrast is lower and the edges are noisy. As a result often not the whole line is detected and thus the line detection extracts short lines. This is not a big problem when it happens in both images, the reconstructed line is just shorter. Obviously, it is a problem when it happens just in one image. The correspondence analysis compares different kinds of properties, amongst other things also the length and the similarity between the start and end point. If the difference between both lines is big enough, no correspondence can be established.
|
To get an idea how the line detection works in a more natural environment, the next section uses real data to gain its results. The coordinates of the lines are manually extracted in this case.
Next: Real data
Up: Line Detection